 Investor
Presentation Investor Presentation
Exhibit 99.1 |
| Investor
Presentation Investor Presentation
Exhibit 99.1 |
 Safe
Harbor 2
This
presentation
may
contain
certain
forward-looking
statements
and
management
may
make
additional
forward-looking
statements
in
response
to
your
questions.
These
statements
do
not
guarantee
future
performance
and
speak
only
as
of
the
date
hereof,
and
qualify
for
the
safe
harbor
provided
by
Section
21E
of
the
Securities
Exchange
Act
of
1934,
as
amended,
and
Section
27A
of
the
Securities
Act
of
1933.
We
refer
all
of
you
to
the
risk
factors
contained
in
US
Auto
Parts
Annual
Report
on
Form
10-K
and
quarterly
reports
on
Form
10-Q
filed
with
the
Securities
and
Exchange
Commission,
for
more
detailed
discussion
on
the
factors
that
can
cause
actual
results
to
differ
materially
from
those
projected
in
any
forward-looking
statements. |
 Case
for Investment 3
Large and Growing Online Market
Significant Customer Reach
Significant Private Label Offering
Reduced Cost Structure
No Debt
Experienced Leadership Team |
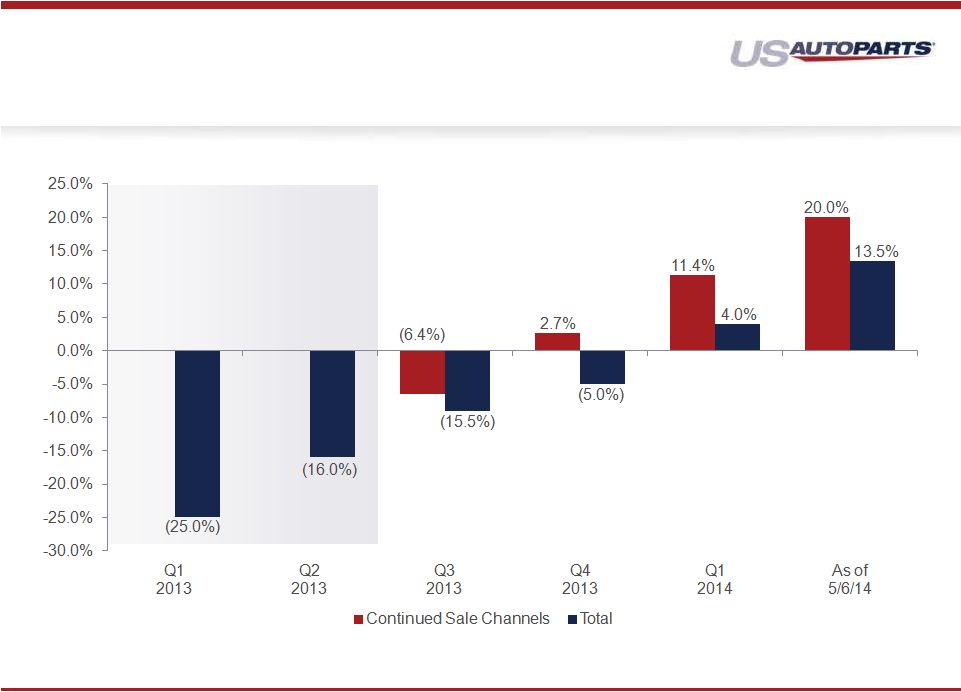
 4
Go forward sales channels up 11% with total comps up 4%
As of 5/6 go forward trend for Q2 trending up 20% and overall
comps up 13%
Adjusted EBITDA was $3.3M up from $1.5M in Q1-13
Adjusted EBITDA less CAPEX was $1.8M up from ($1.1M) in Q1-13
As of 5/6 -
$3M of cash on the balance sheet with no debt
Highlights from Q1-14
Earnings Call |
 5
Completed the retirement of a number of websites by the end of 2Q ‘13
Recent Revenue Trends |
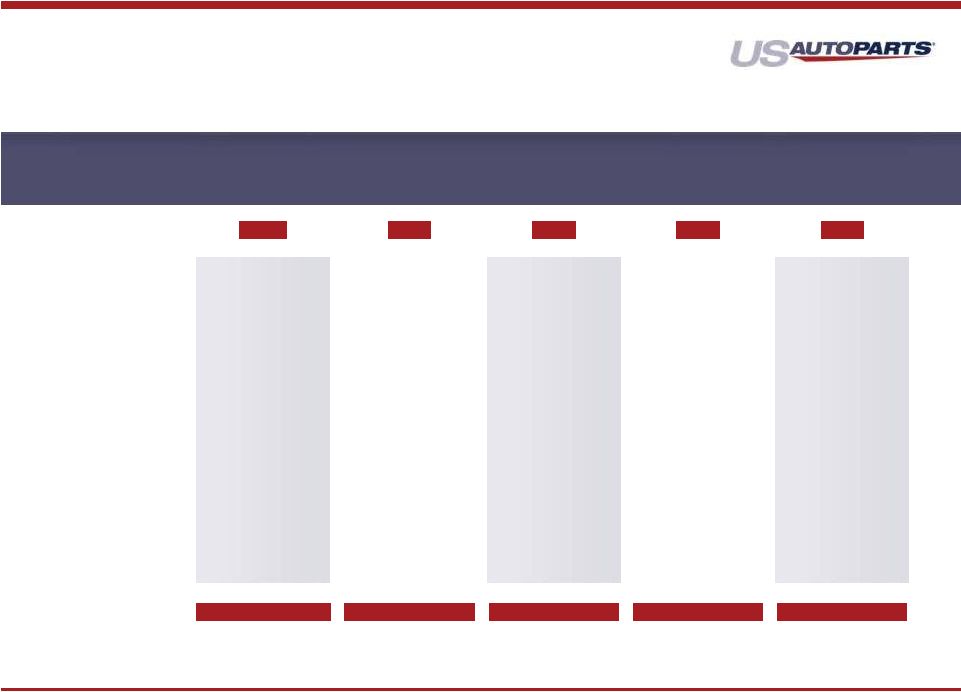
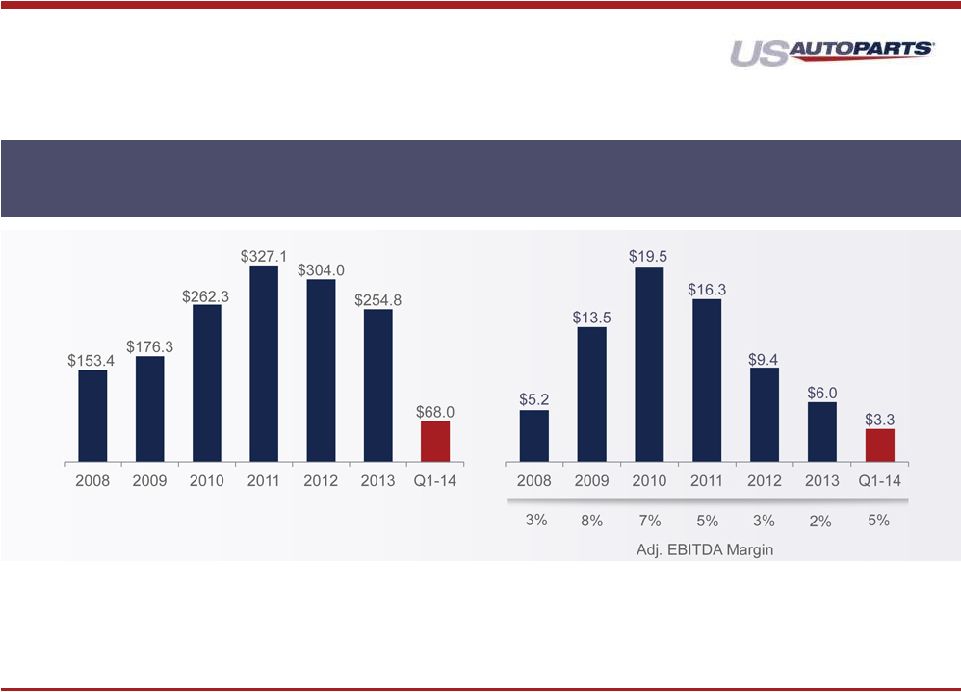 Sales & Adjusted EBITDA
6
1.
JC
Whitney
was
acquired
in
Aug
2010
adding
revenue
of
$39.1M
in
2010
and
$83.4M
in
2011.
Amounts
not
separately
disclosed
after
2011.
2.
Non-GAAP
financial
measure
EBITDA
consists
of
net
income
before
(a)
interest
expense,
net;
(b)
income
tax
provisions;
(c)
amortization
of
intangible
assets;
(d)
depreciation
and
amortization.
Adjusted
EBITDA
excludes
Stock
based
compensation
of
$2.9M,
$3.3M,
$2.7M,
$2.6M,
$1.7M
,
$1.3M
and
$0.4M
in
2008,
2009,
2010,
2011,
2012,
2013
and
Q1-14,
respectively
and
restructuring
costs
and
other
one
time
charges
of
$23.4M,
$0.4M,
$5.8M,
$12.9M,
$27.5M
and
$6.8M
in
2008,
2009,
2010,
2011,
2012
and
2013,
respectively.
There
were
no
restructuring
or
one
time
charges
in
Q1-14.
Consolidated Sales
1
($ In Millions)
Consolidated Adjusted EBITDA
2
($ In Millions) |
 7
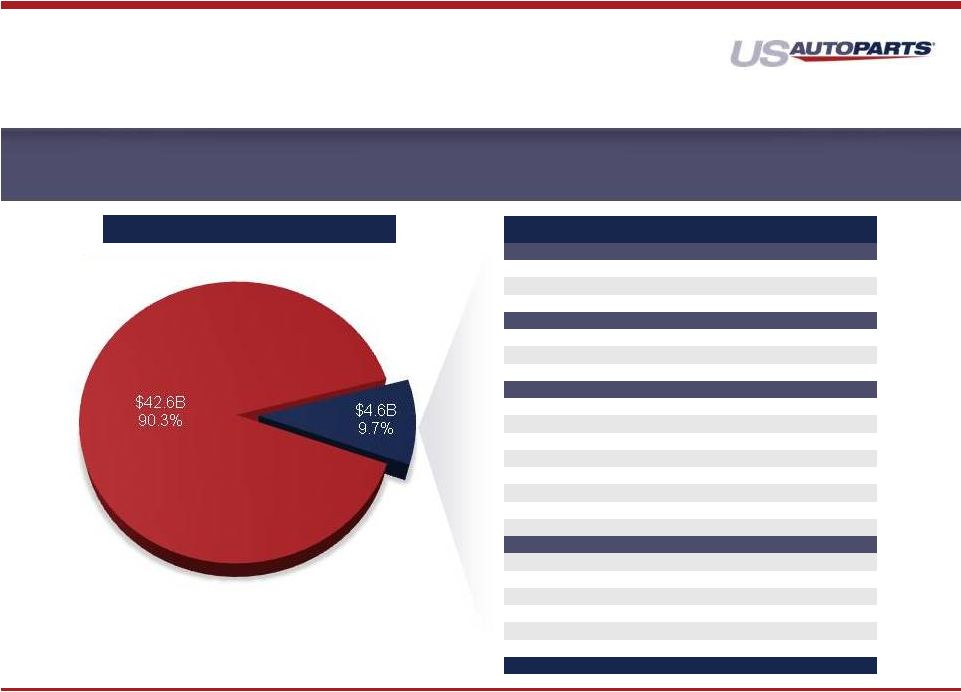
At 9.7% online market penetration, auto parts still lags industry average in the
teens. US Auto Parts is the largest pure-play online retailer of auto
parts 1
AASA
estimates
2
Estimates
by
US
Auto
Parts
where
amounts
are
not
publicly
reported
&
we
estimate
the
total
online
DIY
market
to
be
larger
than
the
$3.8B
that
is
reported
in
the
2014
AAIA
Fact
Book
3
Excludes
AutoAnything
which
is
wholly
owned
by
AutoZone
Do It Yourself (DIY) Market Size
Company
2013 Est. Rev
2
% of total
Marketplaces
(in million)
eBay Motors
$2,200
47.6%
Amazon
$600
13.0%
Sub Total
$2,800
60.6%
Wholesale Online
Tire Rack (online)
$440
9.5%
Other Tire Companies
$190
4.1%
Sub Total
$630
13.6%
Pure Play
USAP
$250
5.4%
Rock Auto
$180
3.9%
Summit
$170
3.7%
Auto Anything
(AutoZone)
$120
2.6%
JEGS
$70
1.5%
CarID
$60
1.3%
All Other Pure Play
$90
1.9%
Sub Total
$940
20.3%
Brick & Mortar Retailers
AutoZone (w/o AA)
3
$110
2.4%
Advance
$80
1.7%
Pep
$30
0.6%
O'Reilly
$20
0.4%
NAPA
$10
0.2%
Sub Total
$250
5.4%
Total
4,620
100.0%
Total
DIY
Market
Size
for
2013
of
47.2B
1 |
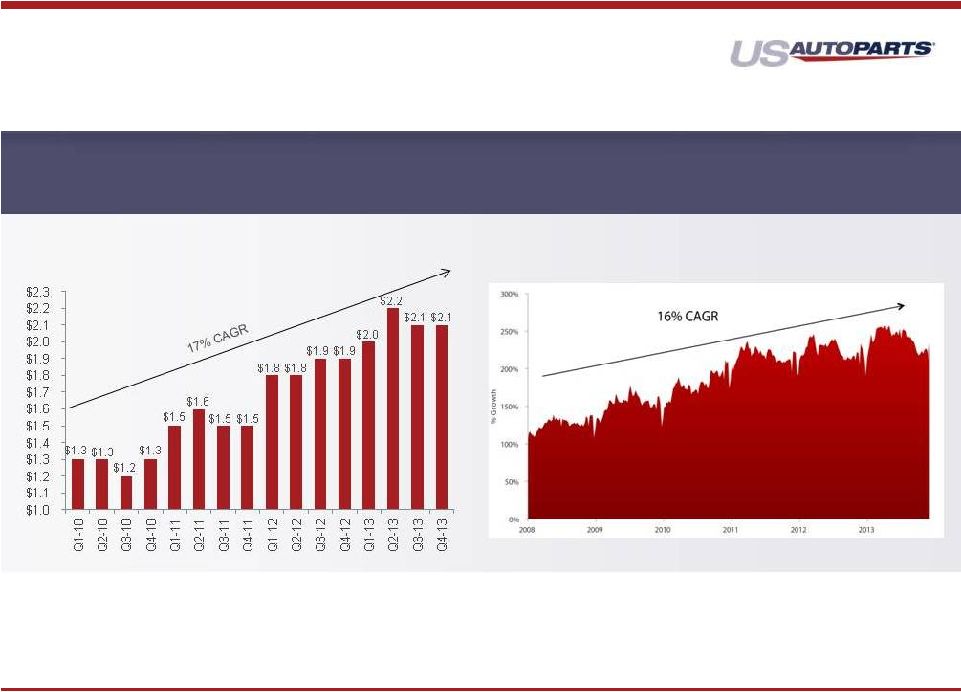 Source: Google
8
eBay Parts Sales Continue to Increase
Source: eBay filings, press releases
Google Queries for Parts Growing
Online Market is Vibrant and Growing
Aftermarket e-Commerce Overview
Online sales of automotive parts and accessories have grown in the high
teens and are expected to grow at 20% going forward |
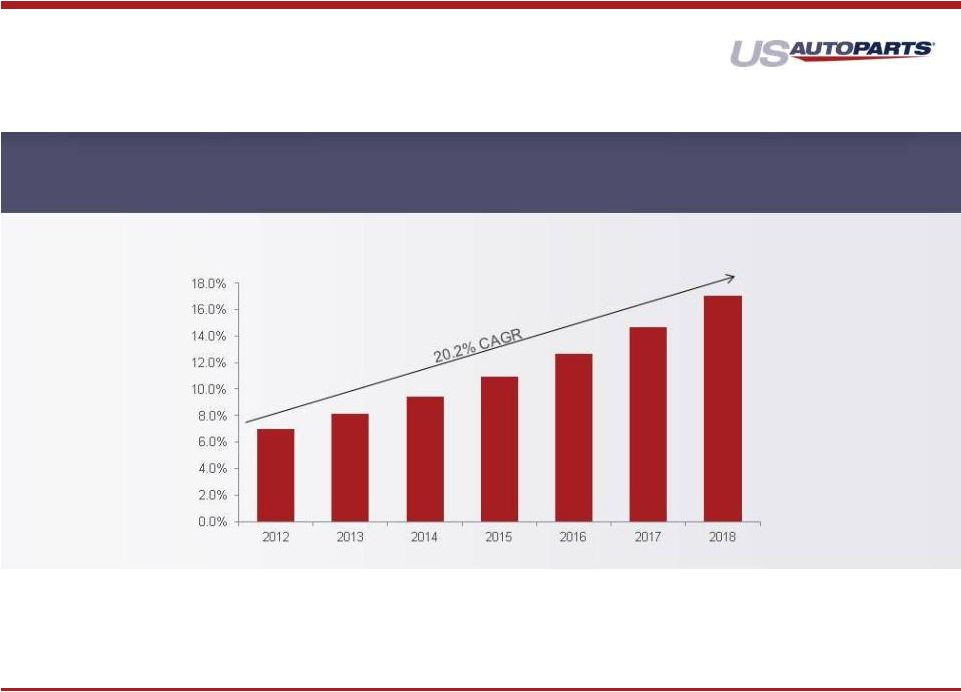 Booz & Co. estimates by 2018 that Online DIY could reach 17%
of the total DIY market
9
Online Market is Vibrant and Growing
Aftermarket e-Commerce Overview
DIY Online Penetration |
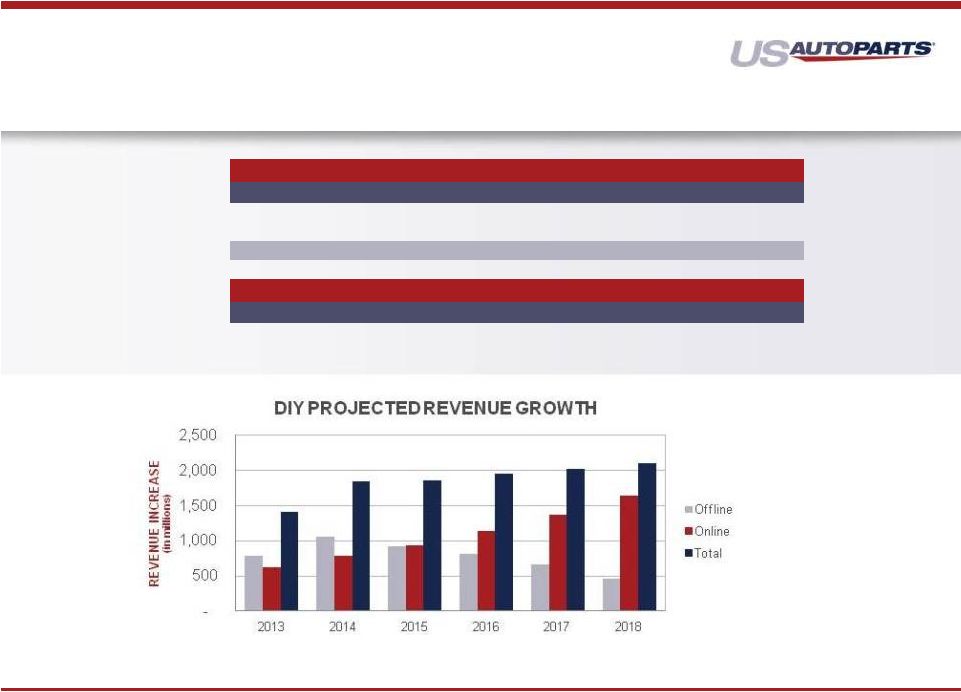 10
Do It Yourself (DIY) Projections
1
DIY PROJECTED REVENUES
(in millions)
2012
2013
2014
2015
2016
2017
2018
Offline
$42,544
$43,331
$44,388
$45,306
$46,120
$46,778
$47,236
Online
3,202
3,827
4,611
5,549
6,680
8,041
9,680
$45,746
$47,158
$48,999
$50,855
$52,800
$54,819
$56,916
DIY PROJECTED MARKET SHARE
2012
2013
2014
2015
2016
2017
2018
Offline
93.0%
91.9%
90.6%
89.1%
87.3%
85.3%
83.0%
Online
7.0%
8.1%
9.4%
10.9%
12.7%
14.7%
17.0%
1
Projections
obtained
from
AAIA
2014
Digital
Automotive
Aftermarket
Fact
Book
and
March
2014
AASA
Digital
Disruption:
e-tailing
in
the
Automotive
Aftermarket
Report |
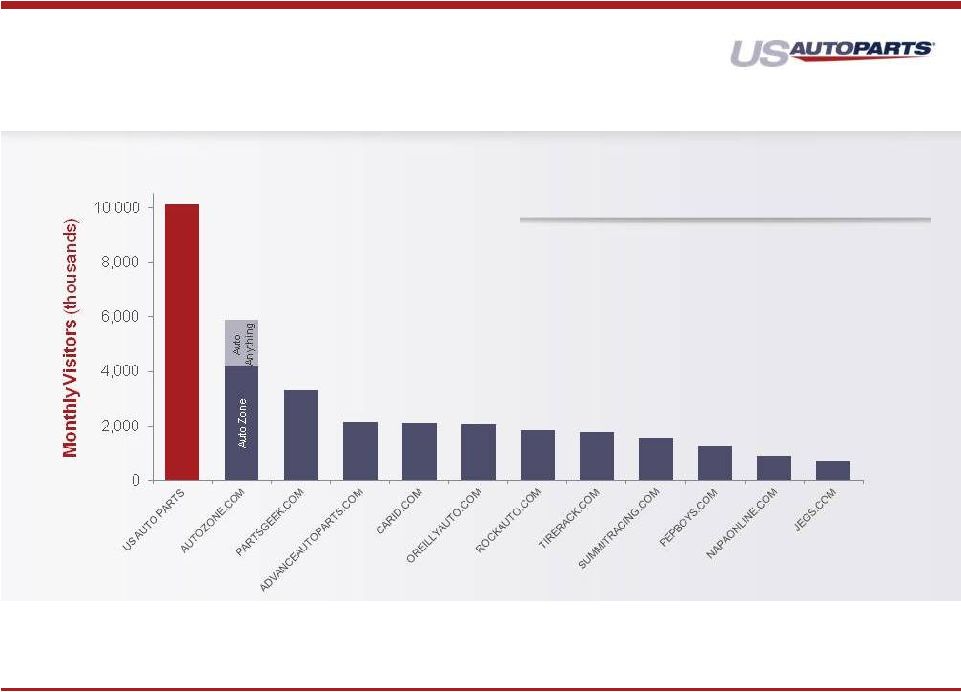 (some overlap of monthly visitors across websites)
11
USAP
traffic
includes
traffic
from
continued
sales
channels
Competitive
sites’
traffic
based
on
Compete
March
2014
reports
Customer Reach is a Competitive Moat
•
Over 500 man years of hand written unique content
•
Long domain history to help indexing in search
•
Multiple website management
US Auto Parts Dominant Reach-
Largest Pure Play Internet Retailer |
 12
Brake
Discs
Catalytic
Converters
Radiators
Headers
Oxygen
Sensors
Alternators
Exhaust
Driveshaft
Fuel Injection /
Delivery
Lamps
Mirrors
Bumpers
Hoods
Tailgates
Doors
Grills
Wheels
Window
Regulators
Seat Covers
Car Covers
Floor Mats /
Carpeting
Cold Air
Intakes
Vent Visors
Tonneau
Covers
Nerf Bars
Bug Shields
Car Bras
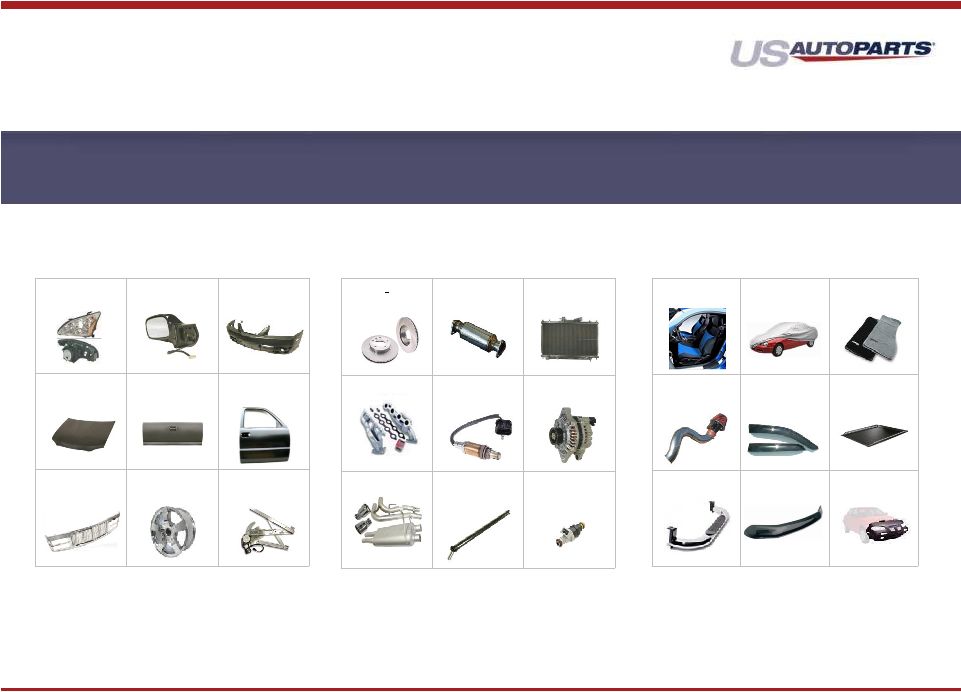
Body Parts
Engine Parts
Performance & Accessories
*Represents
USAP
online
mix
36%
48%
16%
Revenue*
US
Auto
Parts
has
one
of
the
largest
product
offerings
with
over
1.5
million
products
across
body
parts,
engine
parts,
and
performance
&
accessories
Broad Auto Parts Product Offering |
 USAP’s ability to competitively price products while maintaining healthy
margins is a function of the Company’s ability to leverage its robust
private label supply chain. –
Currently over 40,000 Private Label Products.
–
Adding 4,000 –
5,000 Private Label SKUs this year
–
The Company sources product directly from over 200 factories in Asia
13
Margin %
In-Stock
Private Label
(Asia Sourced)
Branded
(U.S. Sourced)
30% -
60%
15% -
30%
5% -
20%
Drop Shipped
Current Mix
55%
45%
Current Mix
68%
32%
The breath of our Private Label products provides a significant competitive
moat USAP’s Supply Chain Creates
Pricing Advantage |
 Revenue
100%
Gross Margins
27% -
29%
Variable OPEX Costs
15%
Fixed Cost
0%
Incremental Flow
12% -
14%
14
Incremental Flow Thru
Recent new trends for our go forward sales channel are growing at 20% as of the 5/6
earnings call Growth and Profitability |
 15
*Excludes non-cash D&A, stock based comp and restructuring
Over $19M of costs have been reduced over a two year period
USAP has significantly reduced
operating cost
OPEX
(in
thousands)
Q1-14
% of rev
Q1-13
% of rev
$ Change
% of rev change
Fulfillment*
3,935
5.8%
3,994
6.1%
(59)
(30 bps)
Marketing*
8,691
12.8%
8,967
13.7%
(276)
(90 bps)
Technology*
1,129
1.7%
1,395
2.1%
(266)
(40 bps)
General & Administrative*
3,620
5.3%
3,873
5.9%
(252)
(60 bps)
Subtotal
17,376
25.5%
18,229
27.9%
(853)
(240 bps)
D&A and Stock Based Comp
2,829
4.2%
4,153
6.3%
(1,324)
(210 bps)
Restructuring
-
0.0%
498
0.8%
(498)
(80 bps)
Total OPEX
20,205
29.7%
22,880
35.0%
(2,675)
(530 bps)
Fixed Cost
7,206
10.6%
8,253
12.6%
(1,047)
(200 bps)
Variable
10,170
14.9%
9,976
15.3%
193
40 bps
D&A & Stock Based Comp
2,829
4.2%
4,153
6.3%
(1,324)
(210 bps)
Restructuring
-
0.0%
498
0.8%
(498)
(80 bps)
Total
20,205
29.7%
22,880
35.0%
(2,675)
(530 bps)
CAPEX
1,558
2.3%
2,623
4.0%
(1,065)
(170 bps)
Total OPEX & CAPEX
21,763
32.0%
25,503
39.0%
(3,740)
(700 bps)
Annualized
87,053
102,012
(14,959) |
 Base
8%
18%
27%
37%
Revenue
$255
$275
$300
$325
$350
Gross Margin %
27.0%
–
29.0%
27.0%
–
29.0%
27.0%
–
29.0%
27.0%
–
29.0%
27.0%
–
29.0%
Variable:
Fulfillment
3.4%
3.4%
3.4%
3.4%
3.4%
Marketing
9.2%
9.2%
9.2%
9.2%
9.2%
Technology
0.6%
0.6%
0.6%
0.6%
0.6%
G&A
1.7%
1.7%
1.7%
1.7%
1.7%
Total Variable
14.9%
14.9%
14.9%
14.9%
14.9%
Fixed:
Fulfillment
2.5%
2.3%
2.1%
2.0%
1.8%
Marketing
3.8%
3.5%
3.2%
3.0%
2.8%
Technology
1.1%
1.1%
1.0%
0.9%
0.8%
G&A
3.8%
3.5%
3.2%
3.0%
2.8%
Total Fixed
11.2%
10.4%
9.5%
8.8%
8.2%
Adjusted EBITDA %
0.9%
–
2.9%
1.7%
–
3.7%
2.5%
–
4.5%
3.3%
–
5.3%
3.9%
–
5.9%
Adjusted EBITDA $
$2
–
$7
$5
–
$10
$8
–
$14
$11
–
$17
$14
–
$21
16
Our business model has significant cost leverage as revenues grow
1.
2013 Revenue was $255M
2.
Excludes stock based compensation, depreciation and amortization
3.
For every incremental year required to achieve growth levels, fixed expenses
increase $1.0M or 3% Financial Sensitivity |
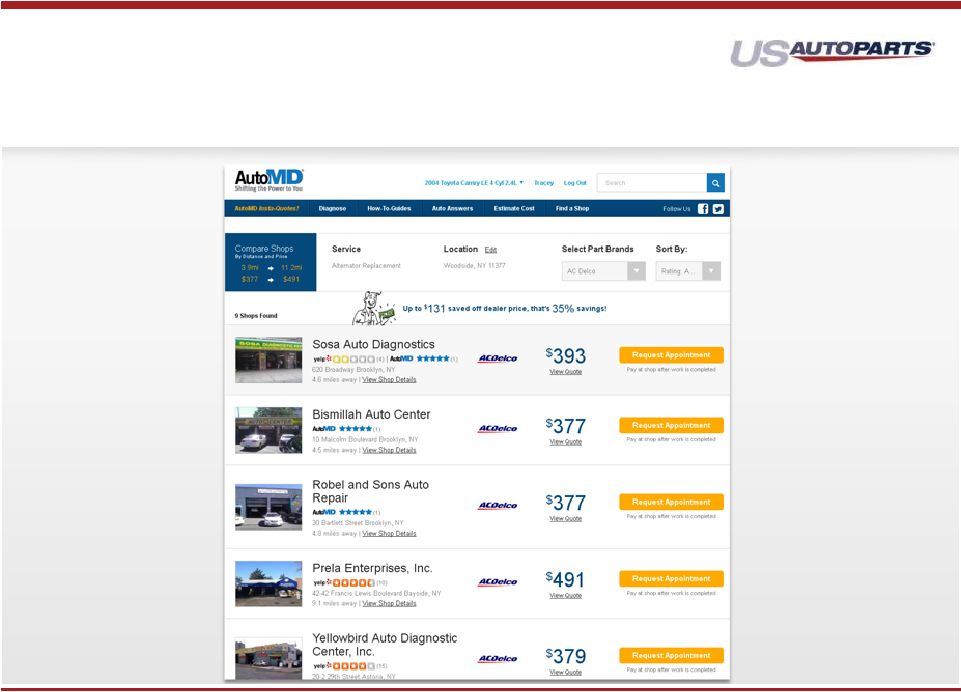 17
AutoMD –
Addressing the
DIFM Market |
 18
Large and Growing Online Market
Significant Customer Reach
Significant Private Label Offering
Reduced Cost Structure over
No Debt
Experienced Leadership Team
Case for Investment |
 19
Shane Evangelist -
Chief Executive Officer
Chief Executive Officer since October 2007 with over 10 years of
leading internet businesses
Senior Vice President and General Manager of Blockbuster Online
Vice President of Strategic Planning for Blockbuster Inc.
B.A. degree in Business Administration from the University of New
Mexico and a M.B.A. from Southern Methodist University
David Robson -
Chief Financial Officer
Chief Financial Officer since January 2012
Over 20 years of finance, accounting, and operational experience
and
has held senior positions with both public and private companies
Executive Vice President and Chief Administrative Officer at Mervyns'
LLC, SVP of Finance and Principal Accounting Officer for Guitar
Center, Inc.
B.S. degree in Accounting from University of Southern California;
certified public accountant
Aaron E. Coleman -
Chief Operating Officer
Chief Operating Officer since September 2010, and was Executive
Vice President of Operations and CIO from April 2008 until September
2010 with over 18 years of e-commerce experience
Senior Vice President –
Online Systems at Blockbuster Inc.
Multiple positions with internet and technology companies including
American Airlines, Travelweb (Priceline), Baan
B.A. degree in Business Administration from Gonzaga University
Leadership Team
Charles Fischer -
Senior Vice President of Global Procurement
Senior Vice President of Global Sourcing and Procurement since May 2008
with over 30 years of global sourcing experience
Vice President, Supply Chain Management for Keystone Automotive Industries
Director, Business Development for Modern Engineering
Multiple leadership positions with multiple companies in the automotive
aftermarket industry |
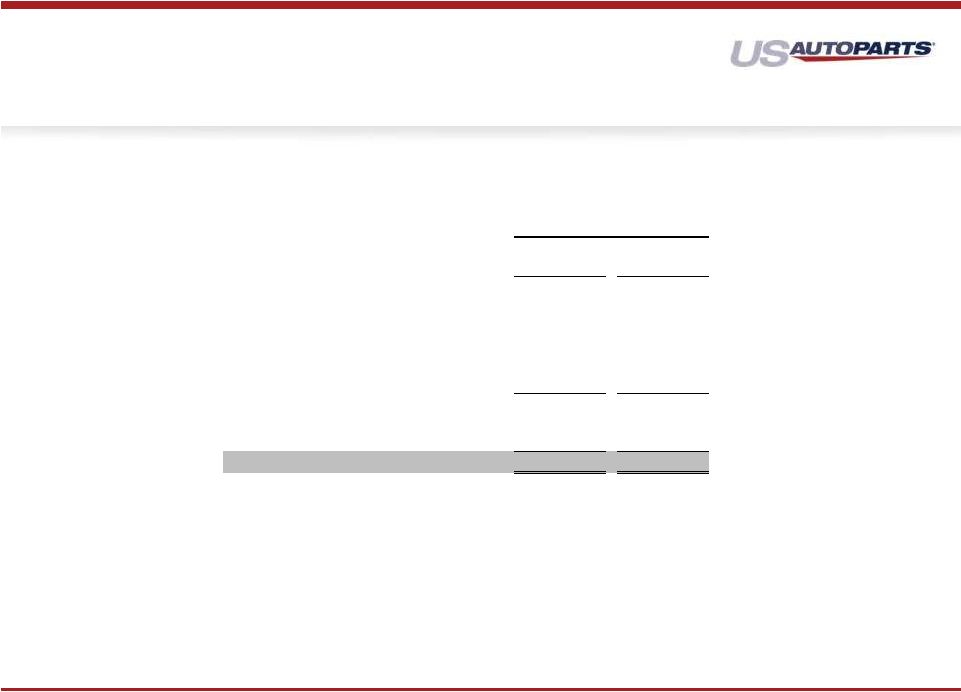 20
Over $19M of costs have been reduced over a two year period
Adjusted EBITDA
(Non-GAAP
Financial
Measure
–
in
thousands)
Thirteen Weeks Ended
March 29
March 30
2014
2013
Net income (loss)
201
$
(3,343)
$
Interest expense, net
259
185
Income tax provision
32
21
Amortization of intangible assets
84
106
Depreciation and amortization expense
2,368
3,638
EBITDA
2,944
607
Share-based compensation expense
376
409
Restructuring costs
-
498
Adjusted EBITDA
3,320
$
1,514
$ |
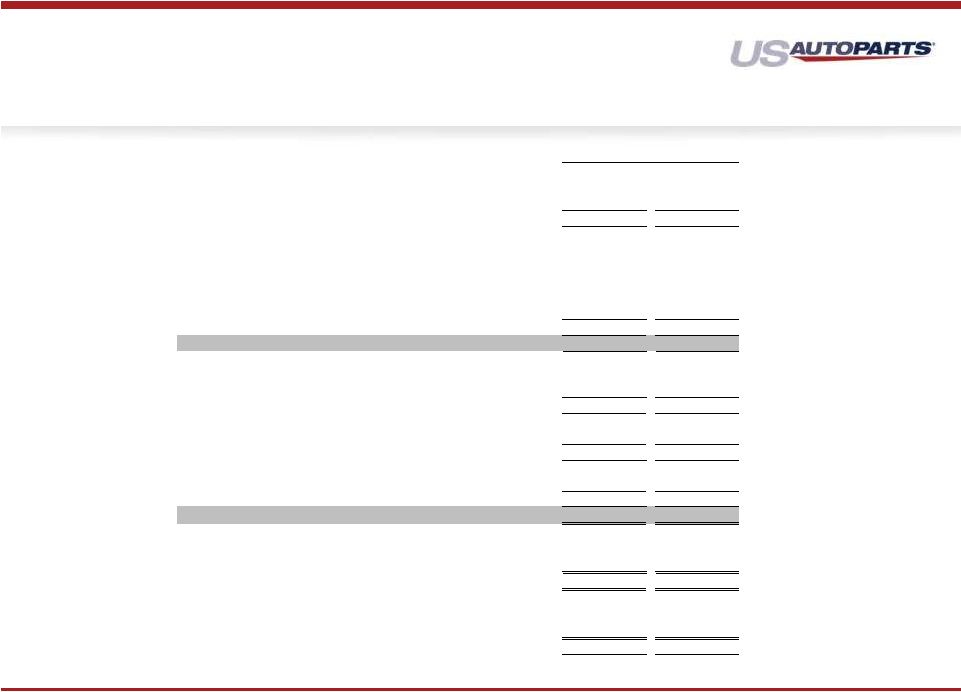 Thirteen Weeks
Ended March 29, 2014
March 30, 2013
Net sales
68,028
$
65,405
$
Cost of sales
(1)
47,327
45,667
Gross profit
20,701
19,738
Operating expenses:
Marketing
10,115
11,191
General and administrative
4,147
4,687
Fulfillment
4,712
5,381
Technology
1,148
1,515
Amortization of intangible assets
84
106
Total operating expenses
20,206
22,880
Income (loss) from operations
495
(3,142)
Other income (expense):
Other income (expense), net
(3)
7
Interest expense
(259)
(187)
Total other expense, net
(262)
(180)
Income (loss) before income tax provision
233
(3,322)
Income tax provison
32
21
Net income (loss)
201
(3,343)
Other comprehensive income (loss), net of tax:
Foreign currency translation adjustments
8
(6)
Total other comprehensive income (loss)
8
(6)
Comprehensive income (loss)
209
$
(3,349)
$
Net income (loss) per share:
Basic
$
0.00 (0.11)
$
Diluted
$
0.00 (0.11)
$
Weighted average common shares outstanding:
Basic
33,384
31,141
Diluted
34,158
31,141
21
Consolidated Statements of Comprehensive Operations
(Unaudited, in Thousands, Except Per Share Data)
(1)
Excludes
depreciation
and
amortization
expense
which
is
included
in
marketing,
general
and
administrative
and
fulfillment
expense. |
 March 29
December 28
ASSETS
2014
2013
Current assets:
Cash and cash equivalents
1,392
$
818
$
Short-term investments
39
47
Accounts receivable, net of allowances of $152 and $213 at
March 29, 2014 and December 28, 2013,
respectively 4,882
5,029
Inventory
36,613
36,986
Other current assets
2,959
3,234
Total current assets
45,885
46,114
Property and equipment, net
18,810
19,663
Intangible assets, net
1,517
1,601
Other non-current assets
1,720
1,804
Total assets
67,932
$
69,182
$
LIABILITIES AND STOCKHOLDERS' EQUITY
Current liabilities:
Accounts payable
21,469
$
19,669
$
Accrued expenses
6,867
5,959
Revolving loan payable
750
6,774
Current portion of capital leases payable
277
269
Other current liabilities
5,383
3,682
Total current liabilities
34,746
36,353
Capital leases payable, net of current portion
9,431
9,502
Deferred income taxes
65
335
Other non-current liabilities
2,125
2,126
Total liabilities
46,367
$
48,316
$
Stockholders' equity:
Series A convertible preferred stock, $0.001 par value; $1.45
per share liquidation value or aggregate of $6,017;
4,150 shares authorized; 4,150 shares issued and
outstanding at March 29, 2014 and December 28, 2013,
respectively 4
4
Common stock, $0.001 par value; 100,000 shares authorized;
33,413 and 33,352 shares shares issued and outstanding
at March 29, 2014 and December 28, 2013, respectively
33
33
Additional paid-in capital
169,243
168,693
Common stock dividend distributable
59
60
Accumulated other comprehensive income
454
446
Accumulated deficit
(148,228)
(148,370)
Total stockholders' equity
21,565
20,866
Total liabilities and equity
67,932
$
69,182
$
22
Consolidated Balance Sheet
(Unaudited, in Thousands, Except Par and Per Share Liquidation value)
|